If you’ve been managing or using Autodesk products for a few years, you’ve probably cracked open a CER file at some point. Customer Error Reporting is Autodesk’s built-in crash reporting system, and it’s been around for a long time. When Civil 3D, AutoCAD, or Revit goes down hard – an unplanned exit – CER packages up what it knows and sends it off. Hardware info, loaded modules, driver versions, last commands, the document being worked on, the faulting code. The whole picture.
For many years and many releases of Autodesk products that data lived in an XML file. You could open it in Notepad, search for GPU, and have a pretty good idea of what happened in under five minutes. Not fancy. But it worked. That changed with the 2025 product line.
A Common Misconception
Most people assume CER data is just for Autodesk. You submit it, it disappears into their systems, and hopefully a future update fixes whatever broke. That’s how a lot of users think about it.
That’s not the whole story.
The crash files live locally on the machine before they ever get uploaded, and there’s a registry key that controls how many are stored on the system. That means you can read them too. And when you do, you stop guessing. I’ve had some real wins in the last few months tracing crashes back to specific hardware configurations, environment issues, customization conflicts, and bad DWG files causing unplanned exits. CER has become my favorite first stop when something doesn’t add up, when a user is reporting repeated crashes, or when I spot something on my radar in a dashboard.
I liked it enough that I submitted sessions on using CER to solve crashes and lost productivity for Autodesk University 2026. The data is genuinely useful beyond individual troubleshooting – it’s a way to build a picture of how your Autodesk users are doing across the entire company, including current update versions and hardware driver health fleet-wide.
What’s Different Now
CER v7 replaced XML with PB files. Protocol Buffers. Binary format. Open one in a text editor now and you get noise. The first time most CAD managers ran into this it wasn’t a great moment.
The reasoning behind the change is solid. XML files were growing, Autodesk was capturing more crash detail, and binary storage is smaller and faster. Integration with Windows Error Reporting also improved, which means better capture rates on crashes the older system sometimes missed. Real infrastructure work. It just broke every workflow users had built around opening that XML file.
Depending on the crash, you may also see a .dmp memory dump alongside the .pb, or multiple .pb files depending on the types of data captured. Two file types, neither of them readable out of the box.
One other change worth knowing: starting with the 2025 products, CER data is sent automatically. Before that, users saw a dialog after a crash and had to choose whether to submit. That dialog is gone now. Reporting happens in the background. For enterprise environments that’s actually good news – your crash data is more complete, and you’re not relying on users to click submit in a moment of frustration.
Where to Find the Files
Files land locally before upload:
C:\Users\Username\AppData\Local\Autodesk\CERYou’re looking for:
- .pb – main crash data
- .dmp – memory dump (realistically only useful if you have the original product source code to trace against in debug)
- Supporting logs in product-specific subfolders
Default retention is five crash reports per product. If you’re supporting more than a handful of machines that’s not enough. Change that number before you need it.
The Tool That Unlocks the Files: cer_rawdataviewer.exe
Once you know the .pb file exists and where to find it, the next question is how to actually open it. That’s where cer_rawdataviewer.exe comes in. This is Autodesk’s own viewer tool that ships with the 2025 products. You’re not downloading a third-party utility or finding something on a forum – it’s already on the machine.
You’ll find it here:
C:\Program Files\Autodesk\Autodesk CER\service\The tool takes a .pb file as input and converts it to JSON you can actually read. That’s the whole job. Point it at a crash file, get readable output back.
Before scripting anything, check what flags your installed version supports. Run this from the command line:
cer_rawdataviewer.exe --helpor
cer_rawdataviewer.exe /?One of those will show you the available arguments. Note them down – they’re what you’ll plug into any automation you build around it.
Putting PowerShell to Work
Once you have the syntax confirmed, the real value is processing files in bulk rather than one at a time. Here’s a script that finds every .pb file in the CER folder, runs each one through the viewer, and saves the JSON output to a folder you can review or feed into something else.
# Set paths
$viewerPath = "C:\Program Files\Autodesk\Autodesk CER\service\cer_rawdataviewer.exe"
$cerRoot    = "$env:LOCALAPPDATA\Autodesk\CER"
$outputDir  = "C:\CEROutput"

# Create output folder if it doesn't exist
if (-not (Test-Path $outputDir)) {
    New-Item -ItemType Directory -Path $outputDir | Out-Null
}

# Find all .pb files recursively
$pbFiles = Get-ChildItem -Path $cerRoot -Filter "*.pb" -Recurse

if ($pbFiles.Count -eq 0) {
    Write-Host "No .pb files found in $cerRoot"
    exit
}

foreach ($file in $pbFiles) {
    $outputFile = Join-Path $outputDir ($file.BaseName + ".json")

    Write-Host "Processing: $($file.FullName)"

    # Replace --input and --output with actual flags from cer_rawdataviewer.exe --help
    & $viewerPath --input $file.FullName --output $outputFile

    if (Test-Path $outputFile) {
        Write-Host "  Saved: $outputFile"
    } else {
        Write-Host "  WARNING: Output not created for $($file.Name)"
    }
}

Write-Host ""
Write-Host "Done. JSON files saved to $outputDir"
The flags on the & $viewerPath line are placeholders. Swap --input and --output with whatever your --help output shows. The rest of the script – finding files, looping, saving output – works regardless.
The path to cer_rawdataviewer.exe may vary slightly depending on which Autodesk product installed it and what version of the CER service is running. Confirm the path on your machine before assuming it matches what’s written here.
Taking It Further: CSV, Power BI, and AI Analysis
JSON isn’t your only option. You can take that same batch process and output directly to CSV instead, which opens up a much faster path into Power BI or Excel for building dashboards across your fleet.
$outputDir = "C:\CEROutput"
$csvPath   = "C:\CEROutput\cer_summary.csv"

Get-ChildItem -Path $outputDir -Filter "*.json" | ForEach-Object {
    $data = Get-Content $_.FullName | ConvertFrom-Json
    [PSCustomObject]@{
        File           = $_.Name
        # Adjust property paths to match your actual JSON structure
        GPUDriver      = $data.hardware.gpu.driverVersion
        FaultingModule = $data.crashInfo.faultingModule
        Product        = $data.application.productName
        WindowsVersion = $data.system.windowsVersion
        CrashDate      = $data.crashInfo.timestamp
    }
} | Export-Csv -Path $csvPath -NoTypeInformation

Write-Host "CSV saved to $csvPath"
Pull that CSV into Power BI and you’ve got a live dashboard showing crash rates by product version, GPU driver distribution, and faulting module frequency across your entire user base. Connecting it to a shared folder that gets updated regularly means the dashboard stays current without manual work.
The other path worth knowing about is feeding the JSON or CSV directly into an AI tool for analysis. Claude and ChatGPT are both solid at this, and Claude in particular is good at spotting patterns in crash data that would otherwise look like noise to most people. What feels like a haystack with no needle in it often has a clear signal buried in it – a driver version showing up disproportionately before faults, a specific module that keeps appearing across machines in the same office, a pattern that only surfaces after a recent update rollout. That kind of insight is exactly what these tools are built for, and CER data gives them something concrete to work with.
Drop your CSV or a batch of JSON files into a conversation, describe what you’re managing, and ask it to look for clusters and outliers. You’ll often walk away with a lead you wouldn’t have found manually.
What You Can Actually Do With This Data
Once you’re pulling CER data consistently, the picture starts coming together fast. A few things worth building out if you’re managing a larger environment:
- Hardware dashboard – GPU models, driver versions, and memory configs across your fleet. You’ll start seeing which hardware combinations show up repeatedly in crash data.
- Software version tracking – who’s on what update, and whether crash rates shift after a rollout.
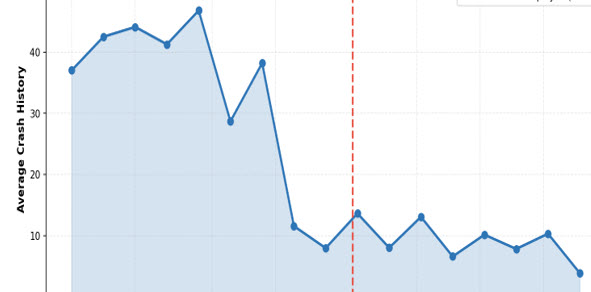
- Crash rate trends – are things getting better or worse after a change you made?
- Cluster analysis – the same faulting module across multiple machines, the same drawing triggering failures on different workstations, a plugin appearing in the loaded modules list right before a fault.
Single crashes are noise. Clusters are signal. When the same pattern shows up across users, departments, or machines, you’re not troubleshooting anymore – you’re diagnosing. And you can show your work. That changes the conversation with vendors, with IT, and with leadership.
I’ve traced crashes back to specific customization conflicts, data issues, and environment problems that never would have surfaced through a support ticket or call alone. CER data got me there faster almost every time.
The PB to JSON conversion adds a step to a workflow that used to be simpler and human readable. But the data quality is better, the capture rate is better, and once you have the process down it’s not much friction. Build a consistent review habit and start treating this data like the diagnostic tool it actually is.
-Shaan