I’ve been writing scripts, LISP, VBA, and llm prompts for years. Lately I’ve been back in Visual Studio, building a Civil 3D plugin in C# that compiles to a .NET DLL. Some Python on the back end for analysis. It feels good to ship something that does real work inside Autodesk Civil 3D instead of around it.
The plugin is an audit tool I wrote to do some internal work. I NETLOAD it into Civil 3D 2024 or 2026 and can be complied for 2025 and 2027 as well and it gives you a set of commands that examine drawings the way a senior CAD manager would, but on every file at once.
What it actually does
Open a drawing. Run the command. It reads the file without rebuilding it, walks the entire reference graph, and writes a JSON snapshot plus, a very detailed txt report, then a high level and pretty HTML report.


The reference walk is the interesting part. Civil 3D has two kinds of references: XREFs (the AutoCAD inheritance from forever ago) and data shortcuts (the Civil 3D way to share alignments, surfaces, profiles, and pipe networks across drawings). DREFs are the consumer side of a data shortcut. The object inside your drawing that pulls from a published source elsewhere.
When data shortcut chains loop back on themselves you get a problem Civil 3D doesn’t recover from cleanly. Two drawings publish to each other. Or one drawing both XREFs and DREFs the same source. Or you’re looking at a surface that’s silently displaying a snapshot from last week because the live source is unreachable. The tool finds all of that.
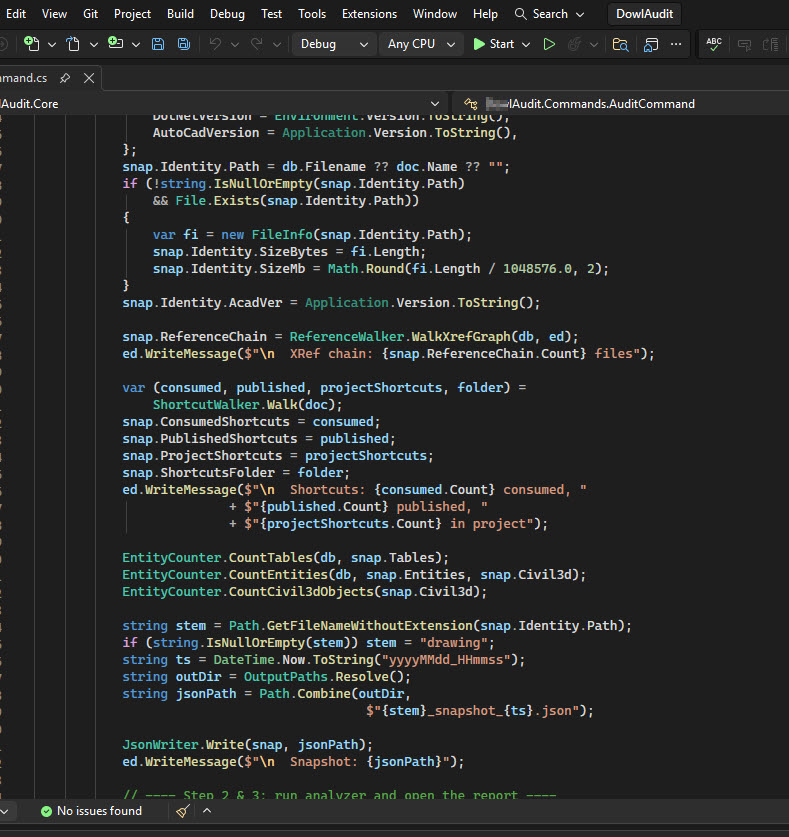
What it captures per drawing:
- File size, DWG format version, who saved it last (Autodesk product or some third-party writer)
- Full XREF tree with Attach vs Overlay flags
- Every data shortcut consumed by this drawing and where it comes from
- Surface health: out-of-date, snapshot stale, lock state, autorebuild on or off, triangle and point counts
- Corridor health: baseline count, region count, out-of-date flag
- Pressure network and parcel inventory
- Layout count, viewport count per layout, AEC objects visible in those viewports
- Object density: total entities per MB, top five heaviest layers by entity count
- All non-DWG references: MMS geometry caches, OLE links, PDF and DGN underlays, images
- AUDIT findings (the structural integrity stuff)


Then it scores the project. Health score with severity-weighted findings 0 Green to 100 Bad. The math is tuned so a single CRITICAL pulls the score down hard, a couple of HIGH warnings move it less, MEDIUM and LOW are nudges. Easy to glance at the badge and know if the project needs attention this morning or this quarter.


Headless mode
The command set includes one that doesn’t need an interactive session. Point it at a folder and walk away. The plugin opens each DWG via the side-load API, grabs what it needs, closes it, moves on. A few hundred drawings take a few minutes. A cache layer skips files that haven’t changed since the last scan. The cache key is path plus mtime plus size, so the next run only touches files that actually moved.
There’s a parallel mode behind an environment variable. Set AUDIT_PARALLEL to 4 or 6 and the walker runs that many side-load workers at once, each with its own Database instance. AutoCAD’s .NET API permits this if you keep the instances isolated. The speedup on slow network shares is the obvious win.
The LAN vs VPN benchmark
There’s a separate command for timing drawing loads. Run it before something matters. A plot job, a heavy DREF refresh, a coordination meeting. It opens the drawing five times, measures the open duration each time, and dumps a JSON with mean, median, percentiles, and the per-iteration breakdown.

I ran it on a sheet set that lives on a Panzura share. Four minutes on a fast LAN. Forty-seven minutes on VPN with the same drawings. That number is real. Most teams don’t measure this, so when someone complains that Civil 3D is slow today the conversation becomes hand-wavy. The benchmark gives you data to point at.
The other thing it shows is xref tier. A drawing with forty or more xrefs is in the structurally-broken category. You can’t optimize your way out of forty xrefs. You have to consolidate. The tool flags those drawings as Tier 3 with a critical finding so they don’t get past triage.
Why I went back to compiled code
Most of my recent work has been looking with local data tools or prompting LLMs to write or analyze things. That’s fine for many problems. It’s the wrong tool when you need to read every file in a 3000-DWG project at the lowest level Civil 3D will let you reach. For that you need to be inside the process. You need a .NET assembly NETLOADed into AutoCAD/C3D with access to the live database, the CivilDocument API, and the entity proxies. A Python script poking at files from outside is missing 80% of the picture because half of what matters lives in dictionaries and reactor relationships that only exist when the drawing is loaded.
So back to Visual Studio. The Python side does the analysis and HTML rendering. The C# side captures the data. Clean split.
What’s next
Sheet set detection. The DST file is just XML. Parse it, cross-reference the sheets to the scanned drawings, surface orphans. Sheets that reference DWGs that no longer exist, or DWGs that have layouts marked as sheets in a DST that nobody opens anymore. Most teams have several DST files in a project. Most of those DST files have orphans. The badges show up in Sheet Set Manager but nobody scrolls through SSM to find them.
After that: layer audit calibration with real data. The thresholds I set are first-pass guesses. Two hundred layers as Tier 3 might be too tight. We’ll see when the data comes in from a few dozen projects.
There’s a longer roadmap but those are the next two.
Writing this kind of tool reminded me how much I like working at this layer and trying to solve complex data mysteries like why a drawing is so complex and causing performance and stability issues impacting large teams adding up to time which equals money. The code and LLM stuff is interesting and useful too. Sitting inside Civil 3Ds process with managed code and watching every reference resolve is a different kind of interesting and fun getting back to my early Autodesk days and writing some C++ and .NET back then.
Cheers,
Shaan